2026 Zwift as a recovery tool 🚲❤️🩹🚲
~3 m
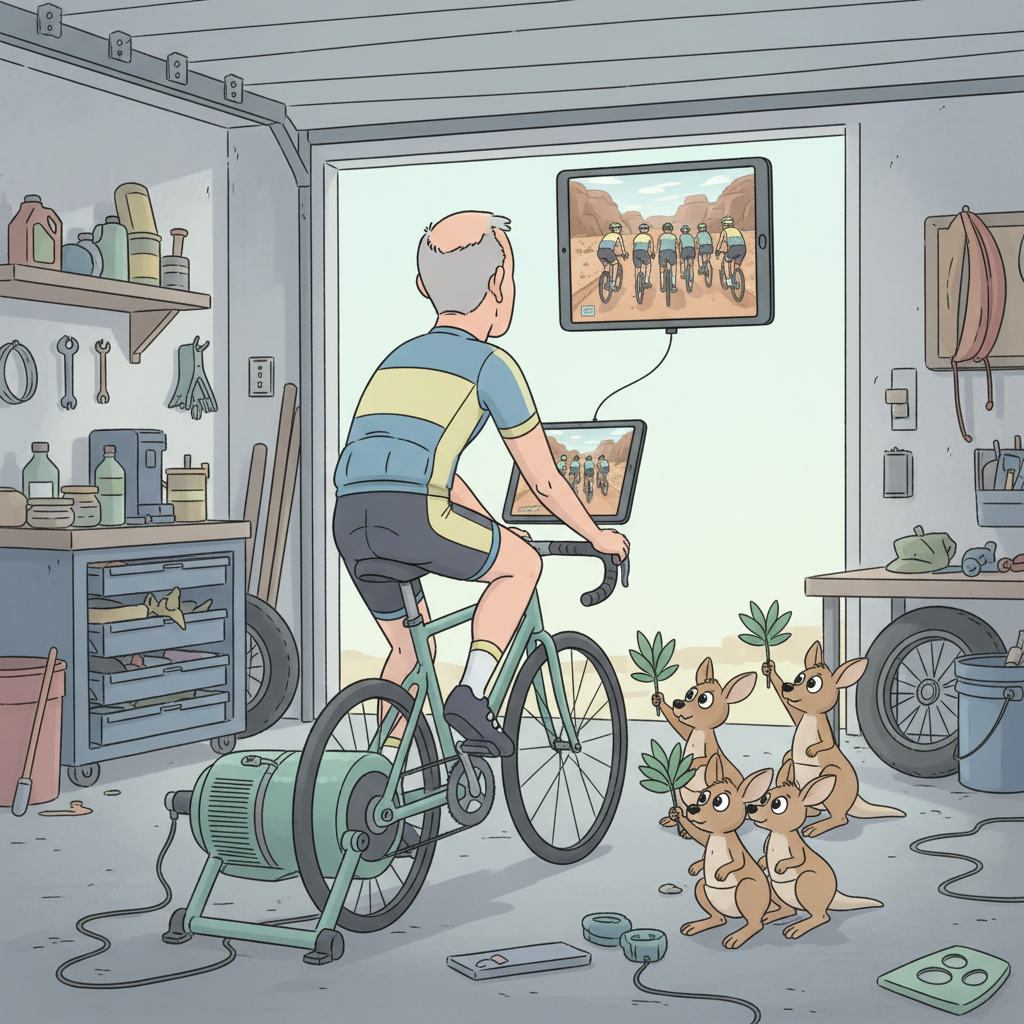
Zwift turns your garage into a home
If you’ve not tried zwift, then just imagine being in your garage, on a bicycle, a fan is on MAX and blowing sweat from your face, over your shoulders and onto the electrical cables behind you. The happy Zwift music is encouraging your to smile and have fun, while the relentless attacks coming from the peleton in your friendly club meetup turn your breathing into a soundscape that would cause Darth Vader to consider a doctor’s visit.
Having said that, if you have the mental fortitude to ignore the other riders, then zwift is an amazing tool for very controlled recovery with strict effort and heart rate limits.
The program
I read a lot. I talked to physios and doctors. I came up with a plan that was agreed on.
168pm- HRmax - my pre-stent-event measured maximum heart rate on a bike (172 for running)41bpm- HRrest - my resting heart rate pre (& post) stent-event
From this we can calculate a value for my recovery heart rate starting at 50%, rising to 80% in about 4 months. There were 2 views on how to do this sum:
- P = the percentage of maximum rising from
50%to80% - method 1:
HR1 = P × (220-age)
i.e. a general formula that applies to everyone (because we’re all the same!) - method 2:
HR2 = P × (HRmax − HRrest) + HRrest
i.e. resting heart rate + a proportion of your heart rate’s measured range
Because nobody agreed on the best way, I chose the average
HRtarget = (HR1 + HR2) ÷ 2
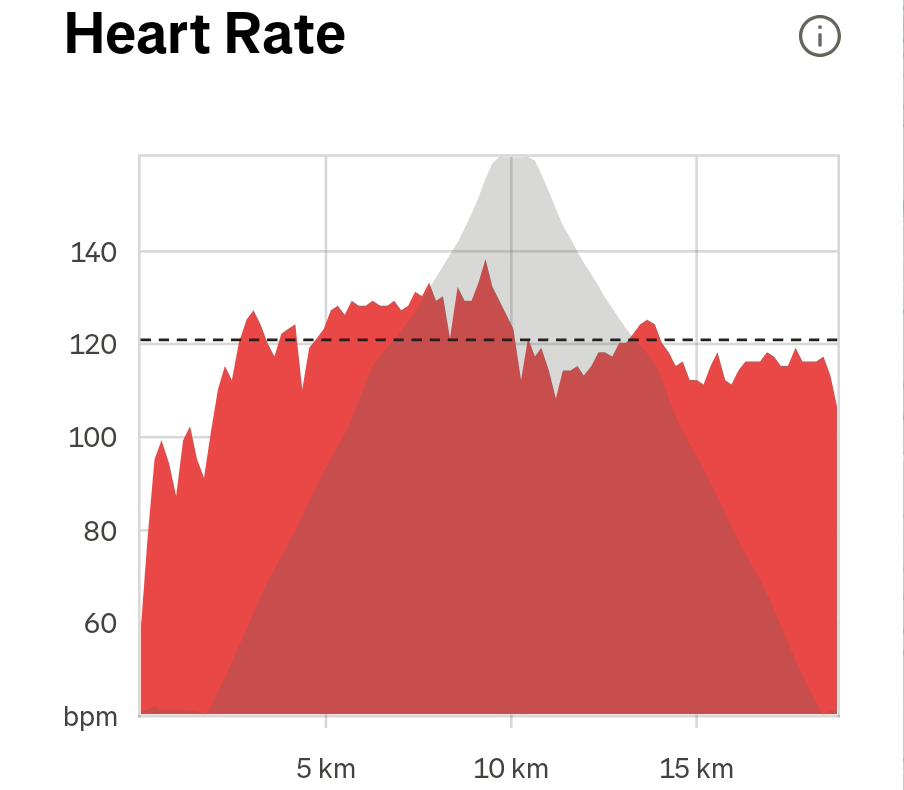
This was my new heart threshold for everything, rising from 92bpm in October 2025 to 135bpm in February 2026. Time
to get the dinosaur on a bike with a fancy accurate chest strap and a healthy dose of self control.
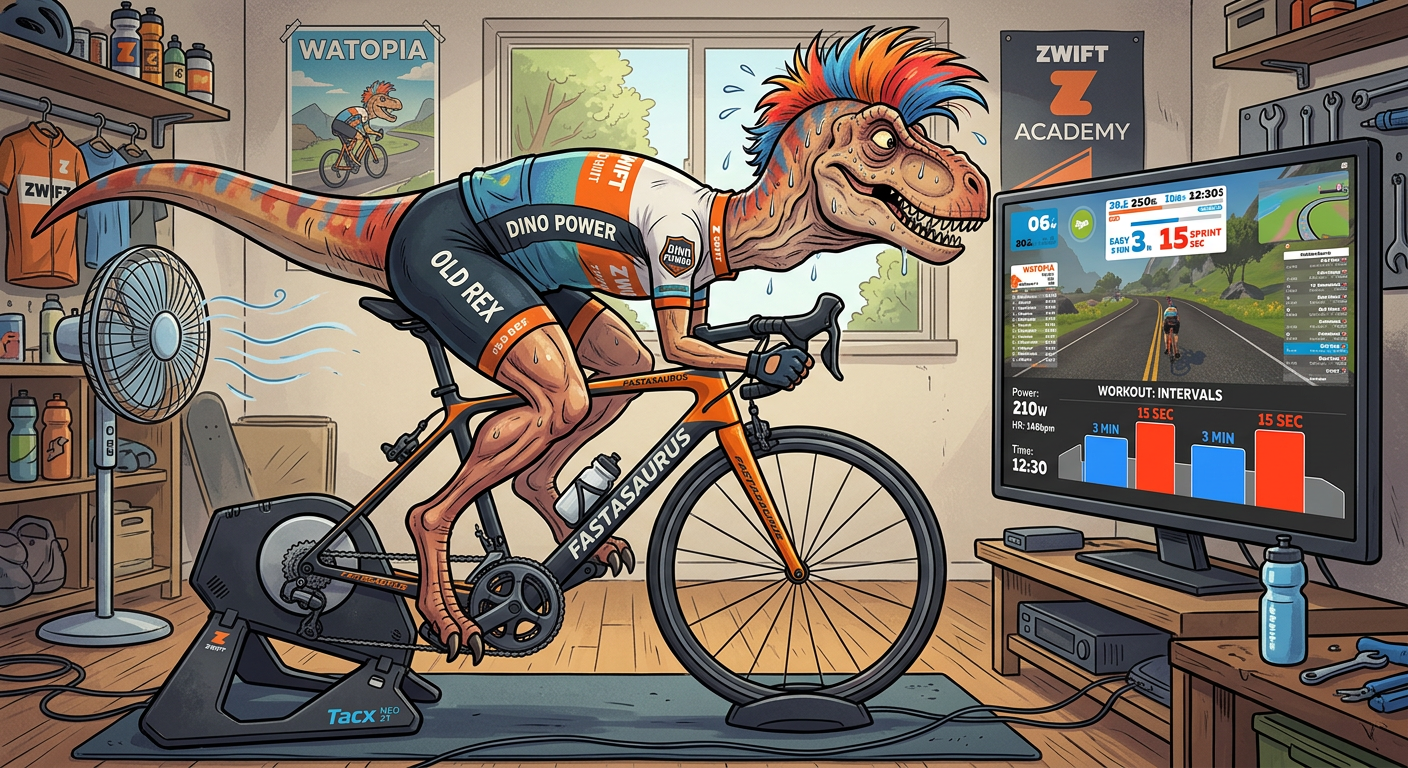
To be honest, the exercise was fine. The most difficult bit was holding myself back. Each little heart rate increment was a real joy because I could pedal a little faster and actually work up a sweat.
The first couple of weeks felt like the weight of my legs was pressing too hard on the pedals to control. It was like taking a 2 year old for a walk. Technically it was exercise, and technically me heart rate went up, but it was frustratingly slow.
Towards the end of this ramp period, I was able to put out enough power to feel like my muscles were at least working a bit, but it wasn’t until the very last couple of increments that I was actually getting out of breath and feeling some strength coming back.
If you’re into cycling, here are some numbers to put the recovery into perspective.
FTP = Functional Threshold Power - roughly how much power you can deliver for 20mins
255W- my pre stent-event FTP - basically very sweaty80W- my post stent-event FTP for92bpmlimit - basically no perceptible exercise performed125W- FTP at Christmas for126bpm- about 1W per bpm - measurable improvement136W- FTP in March for135bpm- still about 1W per bpm - plateau at HRtarget =80%
Time to figure out how to get fitter without upping my heart rate … mostly for the benefit of my sanity!